Sync status dashboard
See the status of all your syncs in one dashboard
The Dashboard tab contains your sync health dashboard: a single place for you to see the health of the most recent run for each of your syncs. This is a single page through which to the answer the question 'Is everything ok?'.
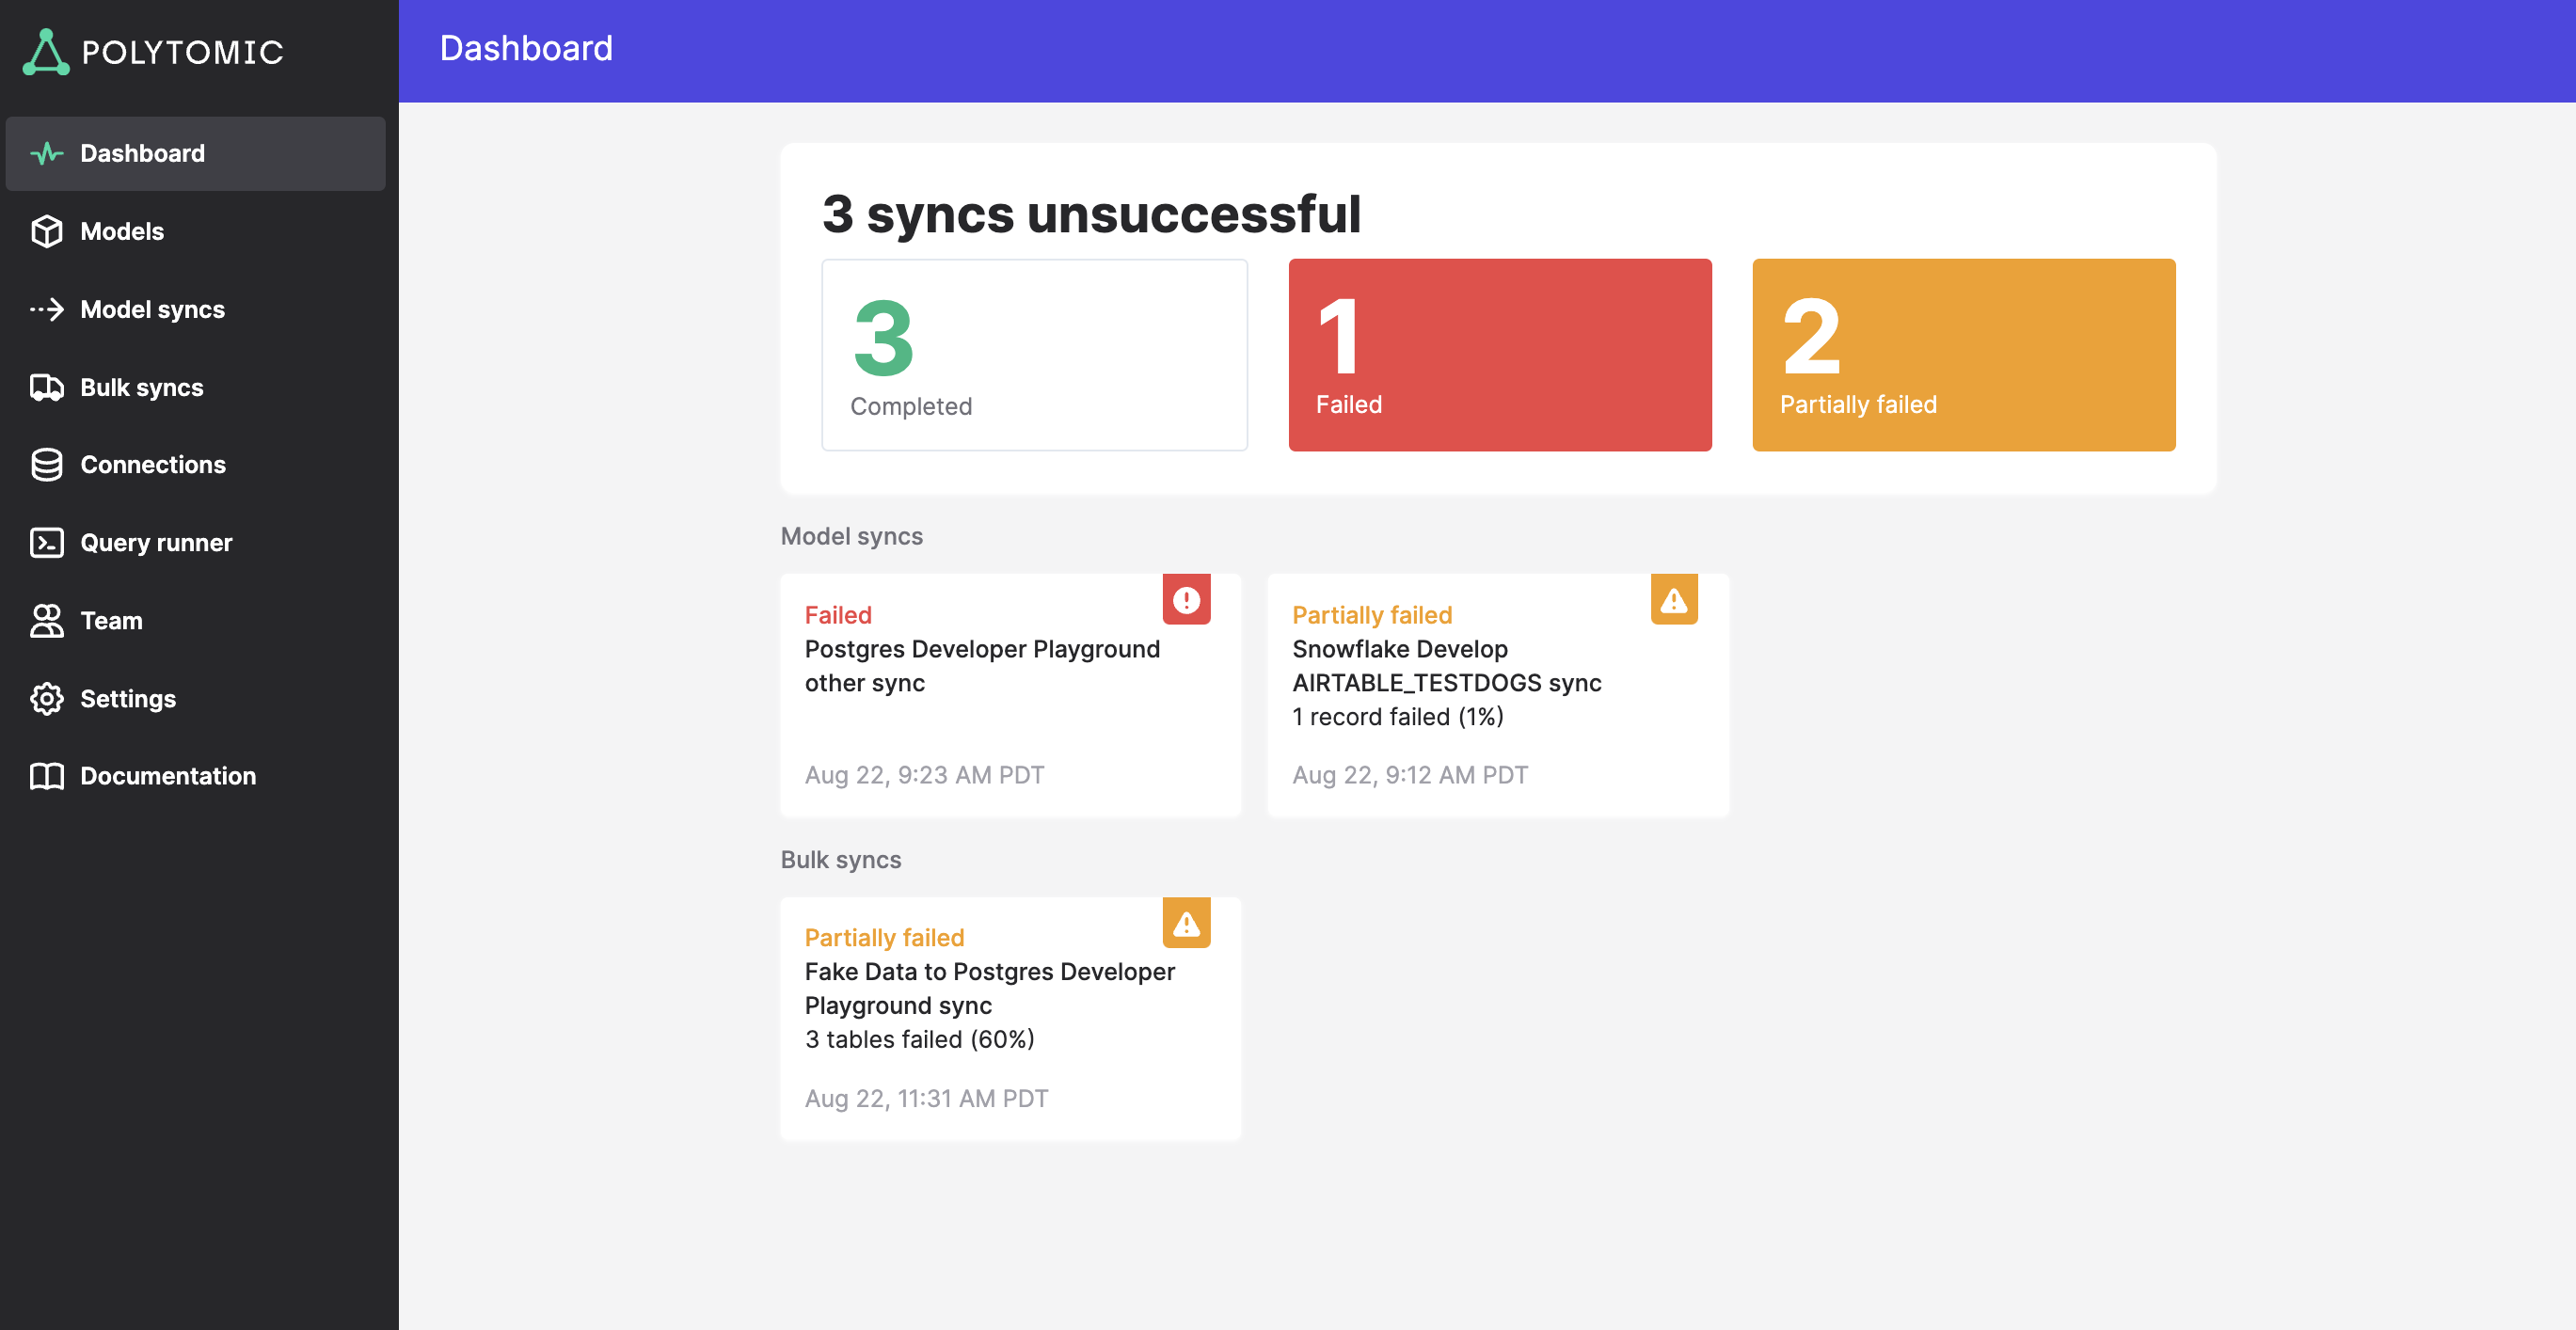
The tiles listing errored syncs are split into groups:
- Model syncs
- Bulk syncs
They also cover two types of errors:
- Failures: cases where the sync completely failed and no data was written to the destination.
- Partial failures: cases where some records/tables failed to write to the destination but others succeeded. The percentage shown indicates what percentage of records (model syncs) or tables (bulk syncs) failed to sync.
Clicking on any of the errored tiles will take you to that sync's run history page.
Reflecting their normal status, no tiles are shown for successful syncs.
Updated about 1 month ago